

Power BI
Our data service also supports integration with Microsoft’s Power BI plataform as it is another popular data visualisation tool.
Running Reports
Importing reports into Power BI is pretty straight forward.
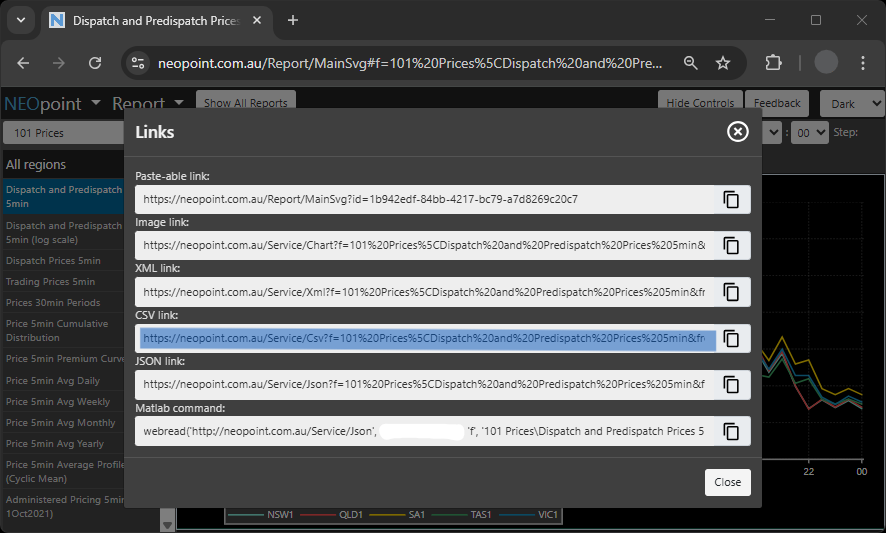
Firstly, in neopoint copy the csv link for your desired report from the links menu.
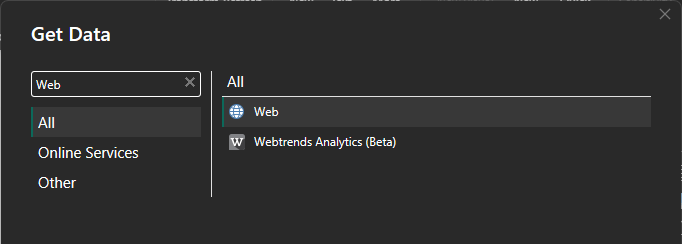
Open Power BI and for the data source select "Web".
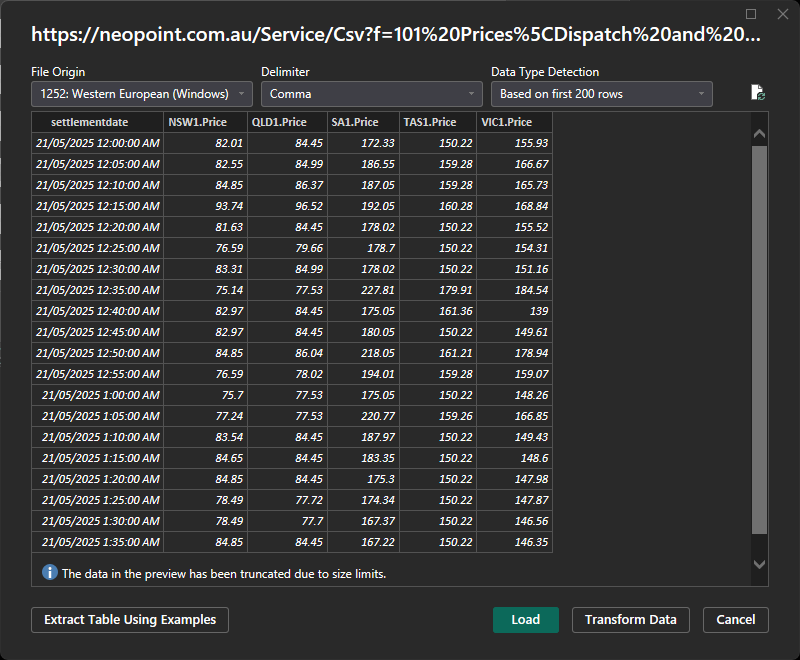
Enter the link you copied from neopoint into the URL field and click OK.
NOTE: make sure to add your api key to the URL.

Leave all the default settings and select Load.
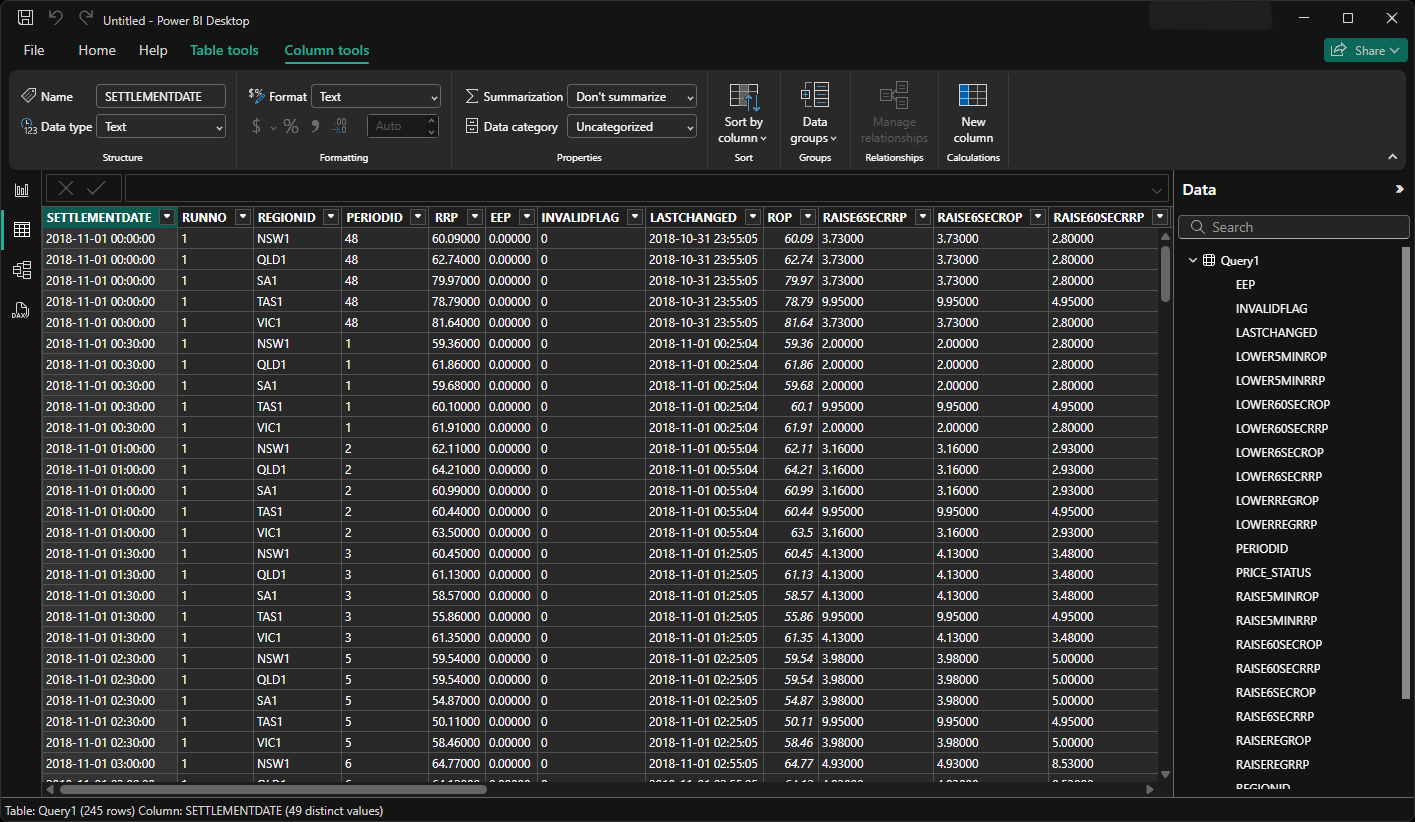
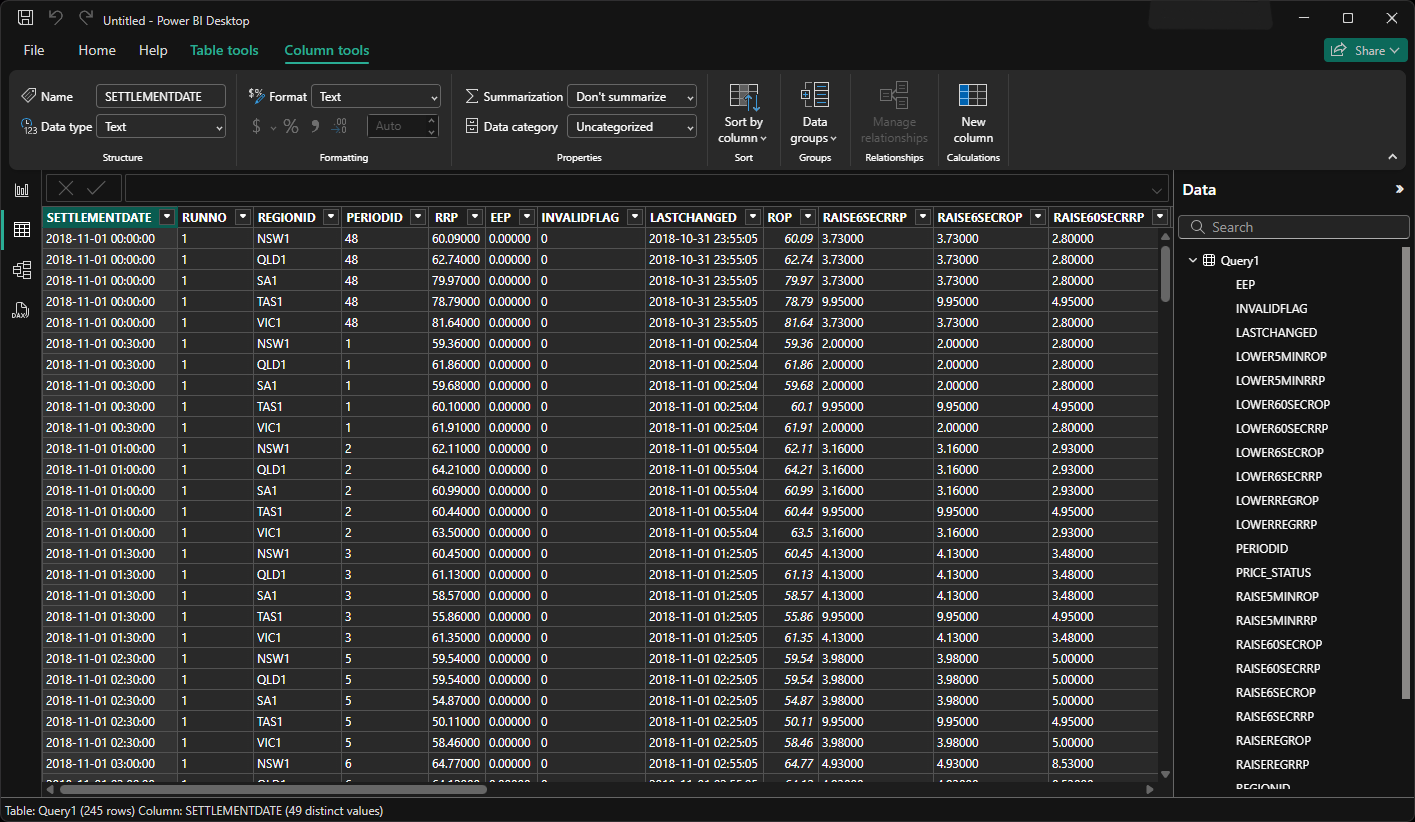
Now if the url is valid, under "Table View" on the home page the data should be visible in table format.
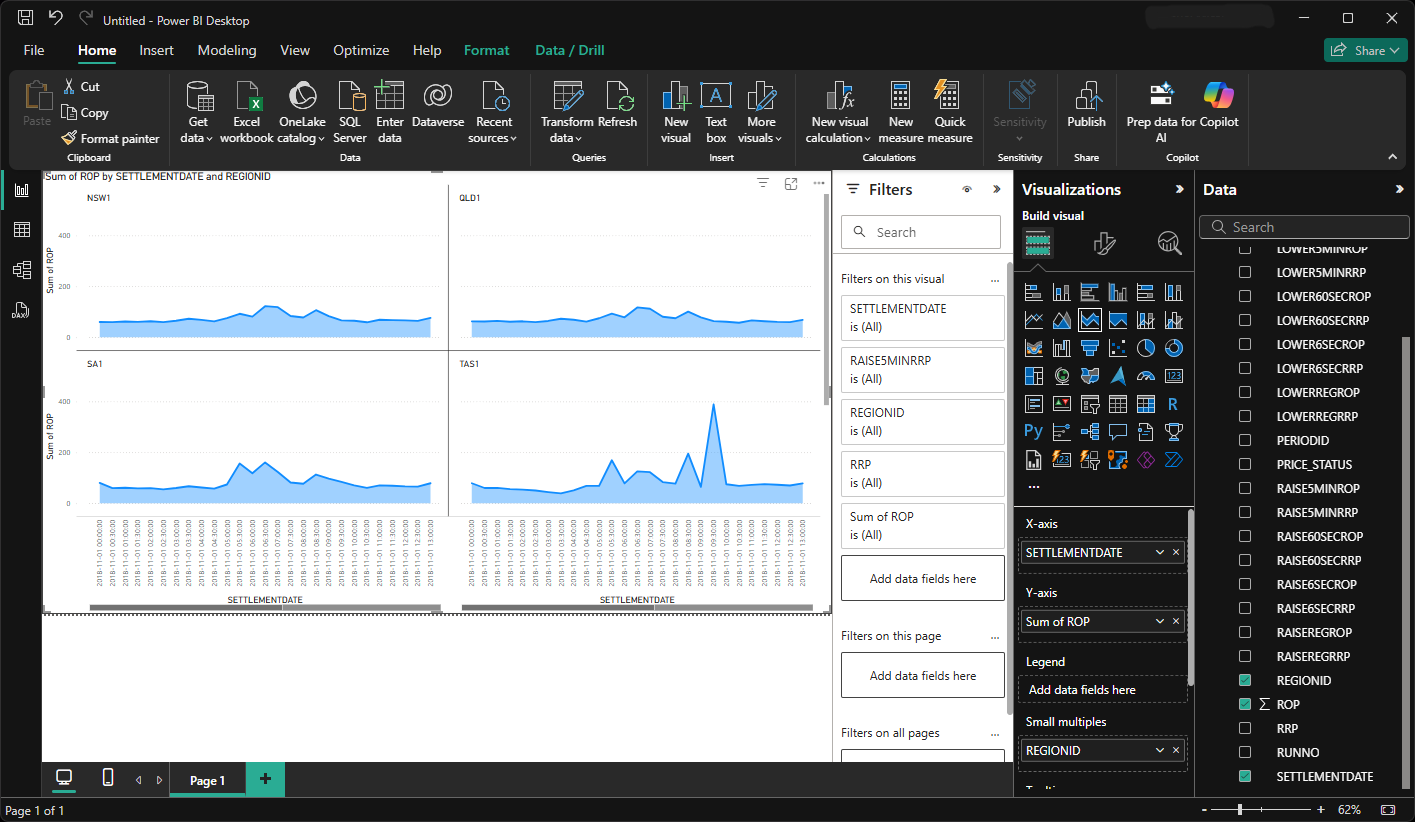
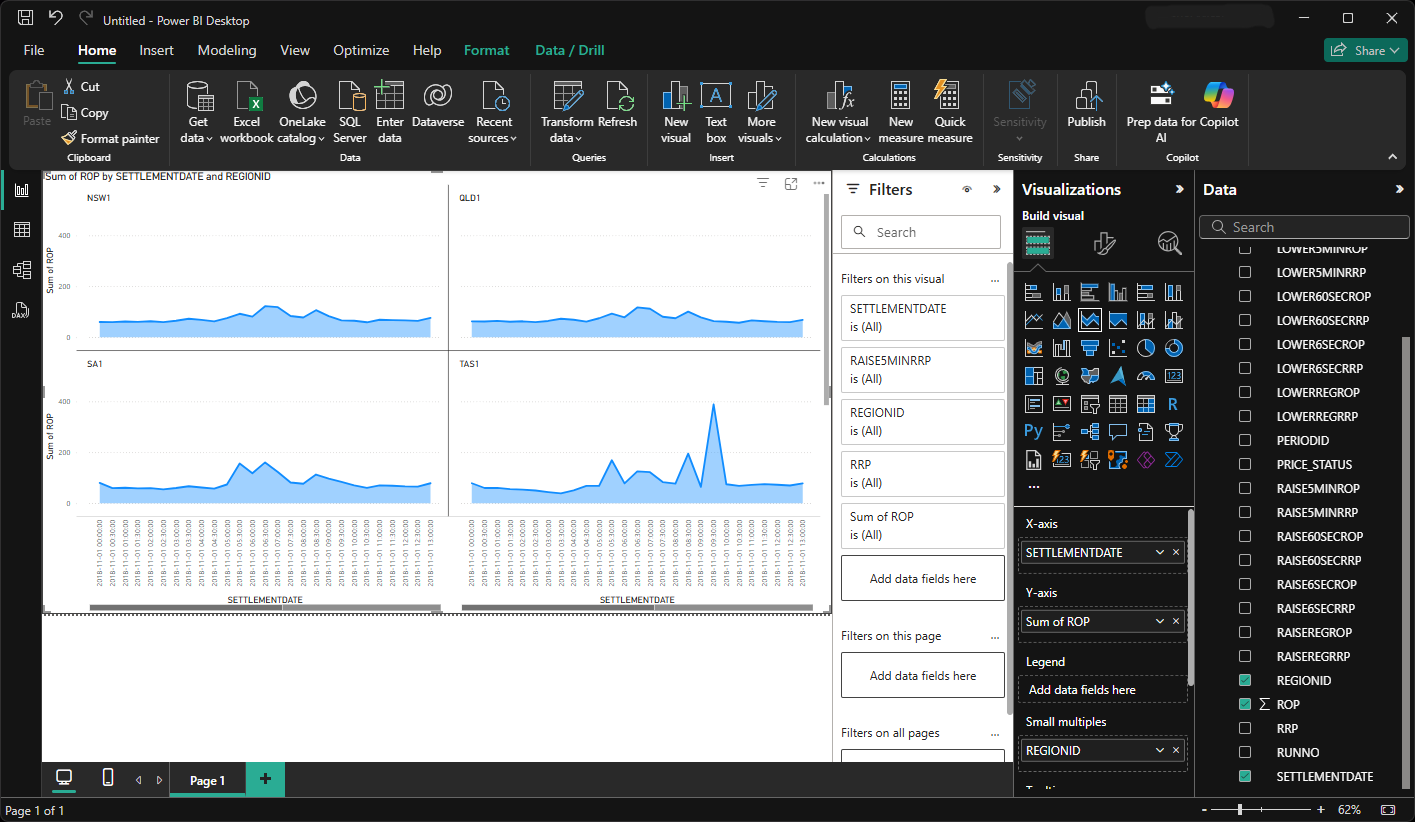
You are now ready to visualise the data in Power BI as you would with any other data.
Running SQL queries
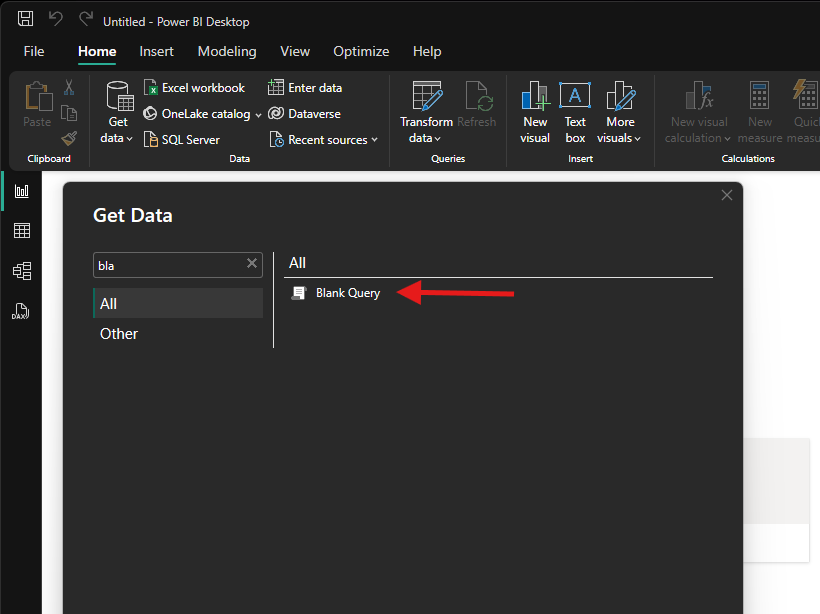
To get data from the data service using an SQL query, first you need to select “Blank Query” for the data source. This will open the Power Query Editor.
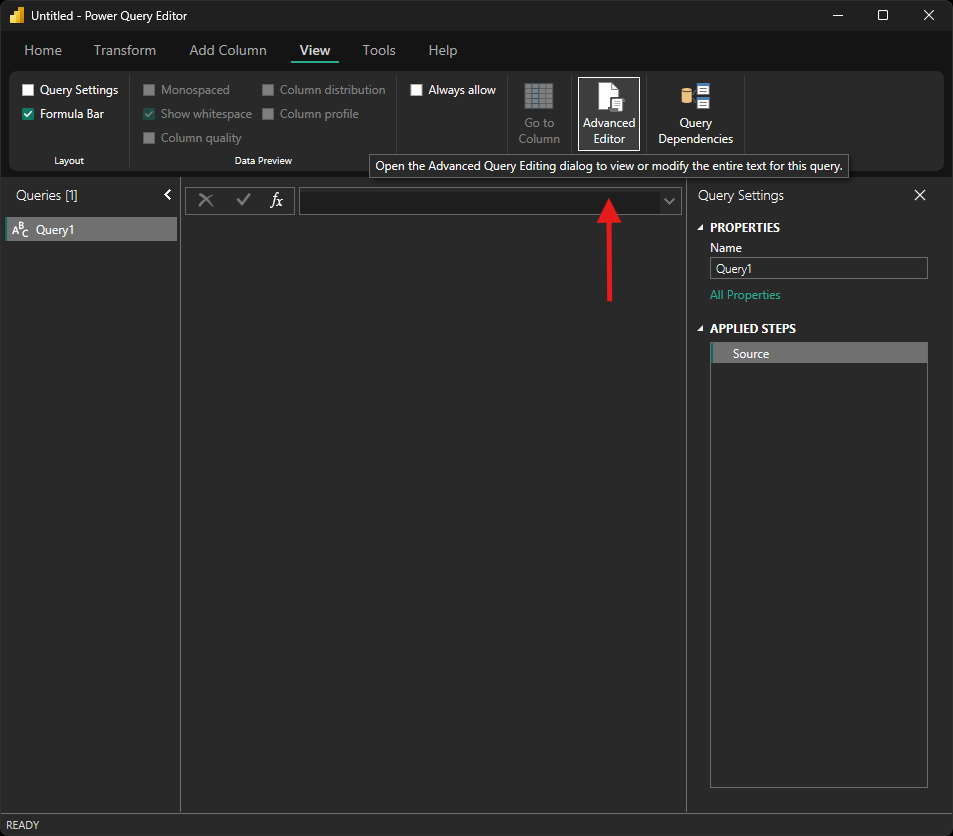
Once the Power Query Editor has loaded, navigate to the "Advanced Editor" which is located under the "View" tab.
In the "Advanced Editor", enter the desired SQL as follows. (remember to replace the ****** with your API key)
let
    queryText = "
        select `SETTLEMENTDATE`, `RUNNO`, `REGIONID`, `PERIODID`, `RRP`, `EEP`,
        `INVALIDFLAG`, `LASTCHANGED`, `ROP`, `RAISE6SECRRP`, `RAISE6SECROP`,
        `RAISE60SECRRP`, `RAISE60SECROP`, `RAISE5MINRRP`, `RAISE5MINROP`,
        `RAISEREGRRP`, `RAISEREGROP`, `LOWER6SECRRP`, `LOWER6SECROP`, `LOWER60SECRRP`,
        `LOWER60SECROP`, `LOWER5MINRRP`, `LOWER5MINROP`, `LOWERREGRRP`, `LOWERREGROP`,
        `PRICE_STATUS` from mms.tradingprice where SETTLEMENTDATE between ""2018-11-1"" and ""2018-11-2"" limit 0, 10000
    ",
    body = Text.ToBinary("query=" & Uri.EscapeDataString(queryText) & "&key=******&format=csv"),
    response = Web.Contents("https://neopoint.com.au/data/query", [
        Headers = [
            #"Content-Type" = "application/x-www-form-urlencoded"
        ],
        Content = body
    ]),
    csv = Csv.Document(response, [Delimiter = ",", Encoding = 65001, QuoteStyle = QuoteStyle.Csv]),
    promoted = Table.PromoteHeaders(csv, [PromoteAllScalars=true])
in
    promoted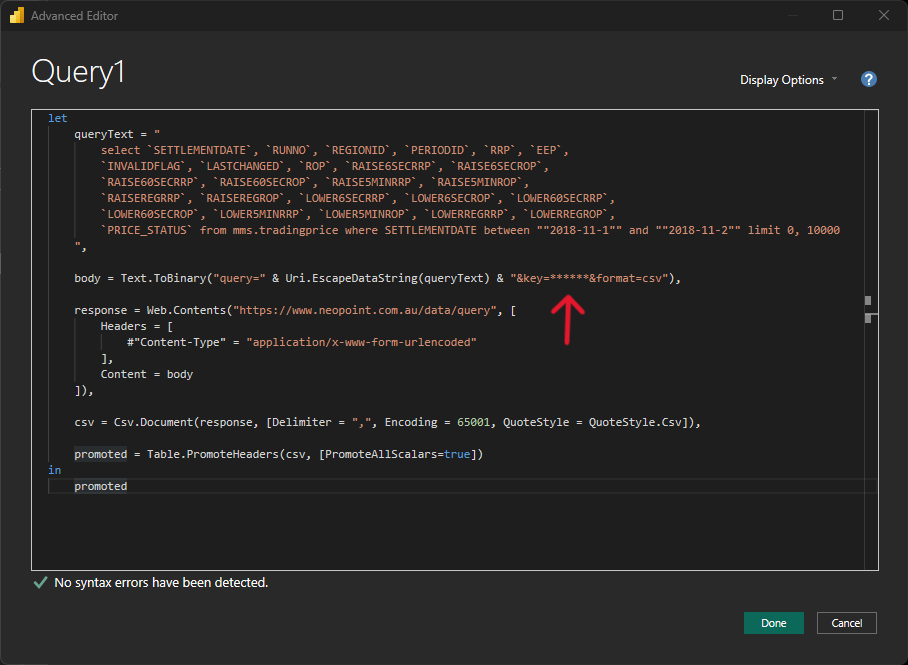
If the request is valid, save the query, return to the main screen.
Under "Table View" the data should now be visible in table format.
You are now ready to visualise the data in Power BI as you would with any other data.
Updated 16 days ago