

Excel
As with all the other tools data services allows you to load multiple data sets automatically. We have an XLSM file that demonstrates a simple case of loading 5 min price and demand from two separate reports. The macro is easy to modify to load any report, time period or instances Excel Sample
Excel expects web query data to be in XML format. You can either load it manually, or if this is something you do on a regular basis you may want to create a macro. The advantages of macros is that you can instantly load any number of live data sets and perform calculations on them all with the press of a button.
Running Reports
To start, open NEOpoint and run the required report and then click the “Links” button, select and copy the link Sample XML link [your API key is required]
An XML link has several parameters that you can customize:
- F – favourites object + selected report name
- Period – report period code
- From – report from date
- Instances – report instances
- Section – depends on the report but in most cases can be left as 0
- Key – NEOpoint login account API key
To manually load a result follow these steps:
- Open a blank Excel worksheet
- Click on the Data tab and click on “From Web”, in the dialog Address paste the URL you copied from NEOpoint, click GO then Import, set the location where you want the data to go
- that’s it – the data should appear in the spreadsheet
The big advantage of data services is automatically loading results. This makes it easy to create spreadsheets that with the click of a button will load several data sets and perform calculations. The macro text below shows how to load data automatically. You can simply copy the text for the macro and paste into your own copy of an Excel spreadsheet, modifying the URL as required. You can also set where you want the data to be loaded and load additional data sets in the same macro by repeating the XmlImport line with the required URL for each additional data set. To understand the macro we also need to explain two other lines of code:
- Every time you import XML data, Excel creates an “XMLMap” so in your macro you need to add some code to delete ALL the XMLMaps otherwise they will keep accumulating. That’s what the XmlMap.Delete line does.
- When data is imported it is marked as read only and hence you can’t load new data on top of it hence we add a “ClearContents” command to clear the contents of the cells you are about to import data into. You will need to adjust the range “G:H” to match the columns where you will be importing data.
The sample macro code is shown below.
Sub GetData1()

'
' Get prices and demand
'
For Each XmlMap In ActiveWorkbook.XmlMaps
                  XmlMap.Delete
        Next

Columns("G:H").ClearContents
ActiveWorkbook.XmlImport URL:= _
        "https://neopoint.com.au/Service/Xml?f=101+Prices%5CRegion+Price+5min&from=2021-10-28+00%3A00&period=Daily&instances=NSW1§ion=-1&key=XXXXXXX" _
        , ImportMap:=Nothing, Overwrite:=True, Destination:=Range("$G$1")

Columns("J:N").ClearContents
ActiveWorkbook.XmlImport URL:= _
        "https://neopoint.com.au/Service/Xml?f=products.iesys.com%5cDemand+5min&period=Daily&from=2016-10-21&instances=NSW1§ion=-1&key=XXXXXXX" _
        , ImportMap:=Nothing, Overwrite:=True, Destination:=Range("$J$1")


End Sub
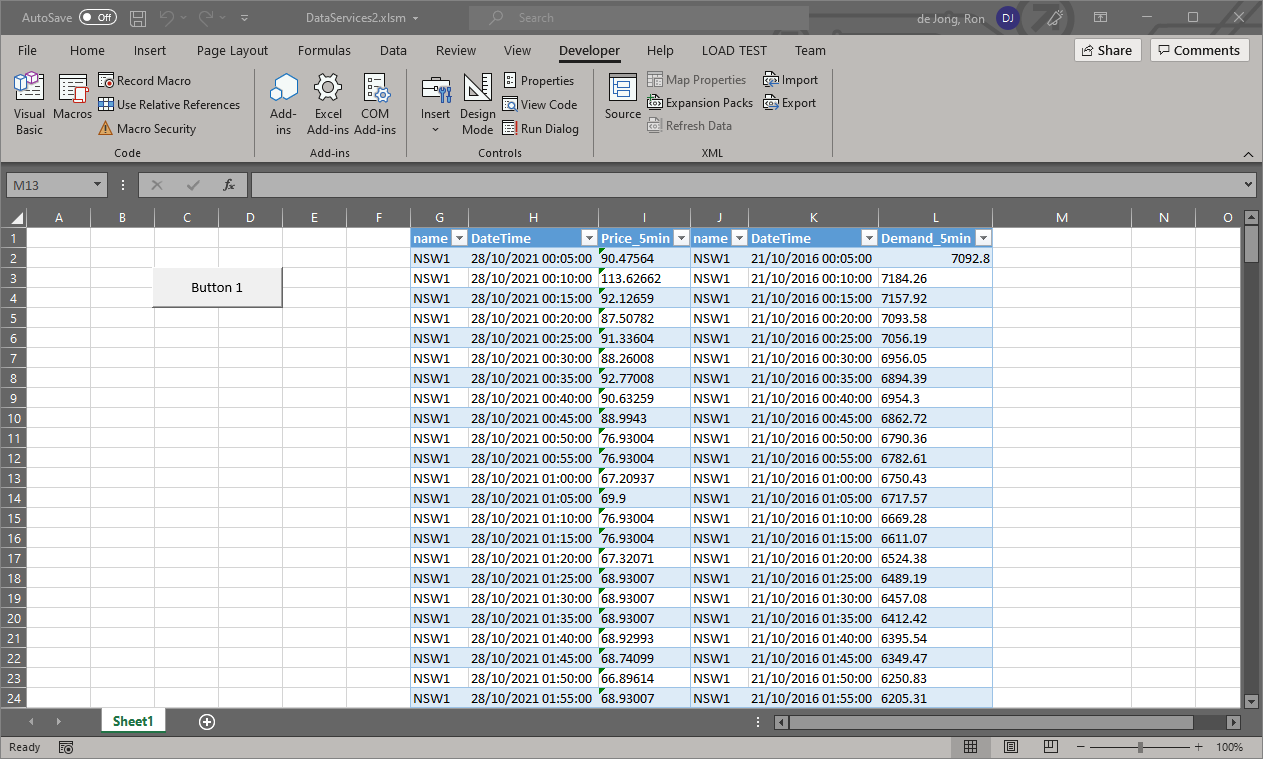
If the above macro is linked to a button and the button is clicked it will load the report results into the spreadsheet as shown below.
Running SQL queries
The sample code below shows how to write a macro that loads data from an SQL query.
Sub LoadData()

'Clear the workbook, adjust based on the columns your query uses
Columns("A:Z").ClearContents

'Put your Query here, ensure that multi line queries are joined together as separate strings (as in the following example)
Query = "select `SETTLEMENTDATE`, `RUNNO`, `REGIONID`, `PERIODID`, `RRP`, `EEP`," & _
"`INVALIDFLAG`, `LASTCHANGED`, `ROP`, `RAISE6SECRRP`, `RAISE6SECROP`, " & _
"`RAISE60SECRRP`, `RAISE60SECROP`, `RAISE5MINRRP`, `RAISE5MINROP`, " & _
"`RAISEREGRRP`, `RAISEREGROP`, `LOWER6SECRRP`, `LOWER6SECROP`, `LOWER60SECRRP`, " & _
"`LOWER60SECROP`, `LOWER5MINRRP`, `LOWER5MINROP`, `LOWERREGRRP`, `LOWERREGROP`, " & _
"`PRICE_STATUS` from mms.tradingprice where SETTLEMENTDATE between '2018-11-01' and '2018-11-02' limit 0, 10000"

'Put your API key here
apikey = "XXXXXXXXXXXXXXXX"

'Make POST Request
Set objHTTP = CreateObject("MSXML2.ServerXMLHTTP")
Url = "https://neopoint.com.au/data/query"
objHTTP.Open "POST", Url, False
objHTTP.setRequestHeader "Content-Type", "application/x-www-form-urlencoded"
objHTTP.Send ("query=" & Query & "&key=" & apikey & "&format=csv")

'get response text
resp = objHTTP.responseText

'Write to File
If objHTTP.Status = "200" Then
    Lines = Split(resp, Chr(10))
    For r = LBound(Lines) To UBound(Lines)
        Values = Split(Lines(r), ", ")
        For c = LBound(Values) To UBound(Values)
            Cells(r + 1, c + 1).Value = Values(c)
        Next c
    Next r
Else
    MsgBox "The POST request failed"
End If

End Sub
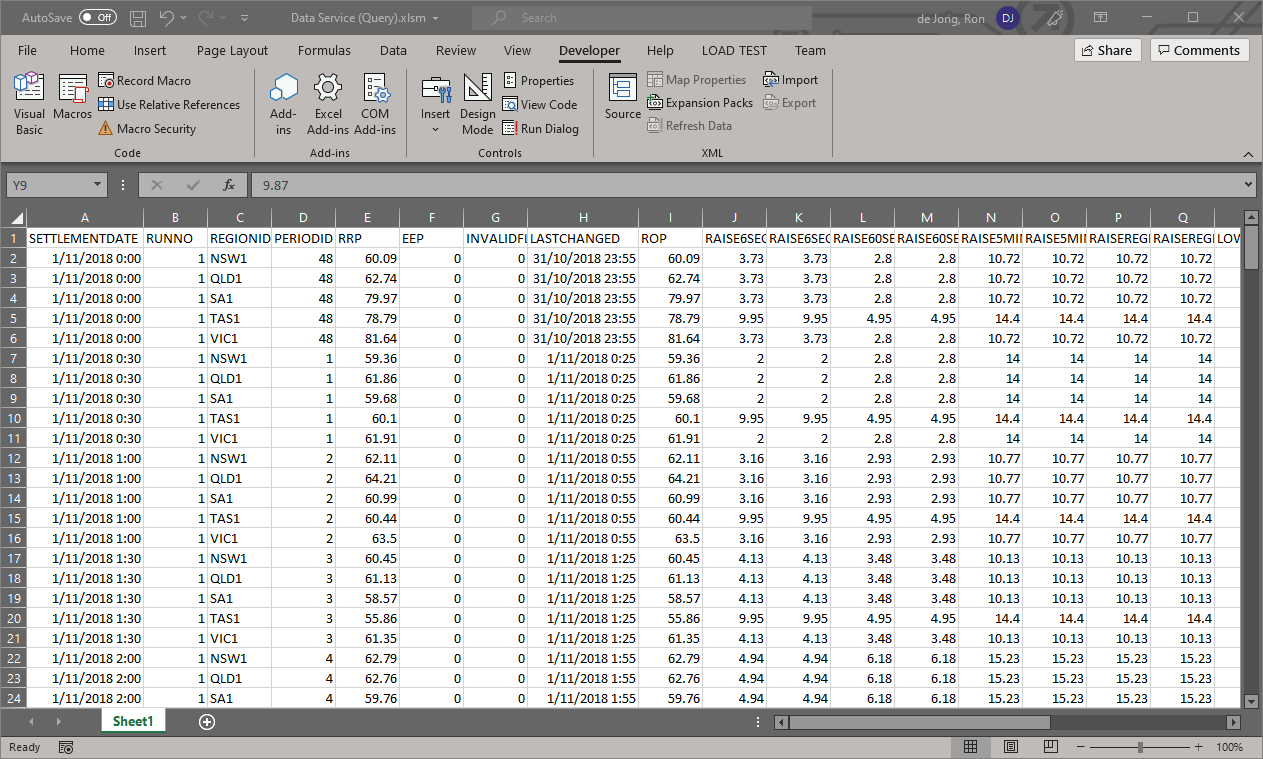
If the above macro is linked to a button and the button is clicked it will load the SQL query results into the spreadsheet as shown below.
Updated 16 days ago