

Grafana
Grafana is an increasingly popular data visualisation tool used by many organisations to create dashboards for system monitoring and data analysis.
Grafana supports a variety of data formats but the main way to ingest our data is using the JSON links from NEOPoint.
Running Reports
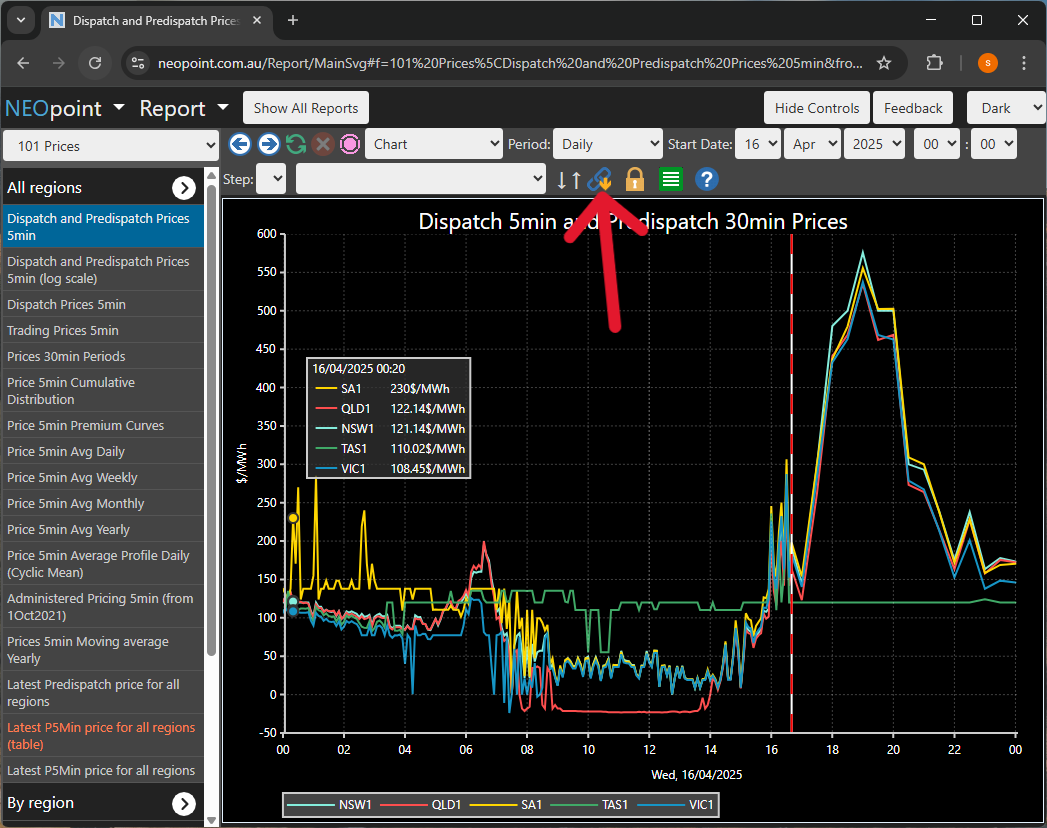
Firstly, find a report in NEOPoint with the desired data and click the links icon:
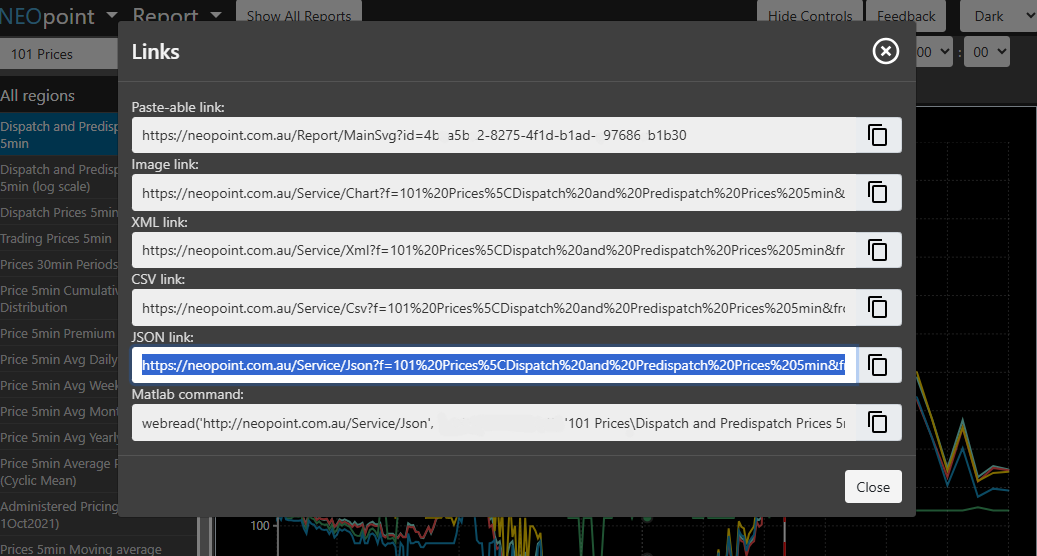
Then, copy the JSON link to you clipboard and move over to Grafana
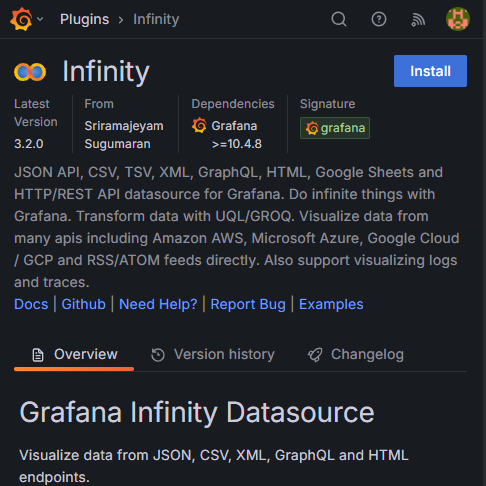
To ingest JSON data make sure you have installed the free Grafana plugin called Infinity Datasource:
Now open up a panel in your dashboard and set the data source to “yesyoreyam-infinity-datasource” and paste the JSON link into the URL field. (make sure to add your API key to the url)
Also make sure type is set to JSON.
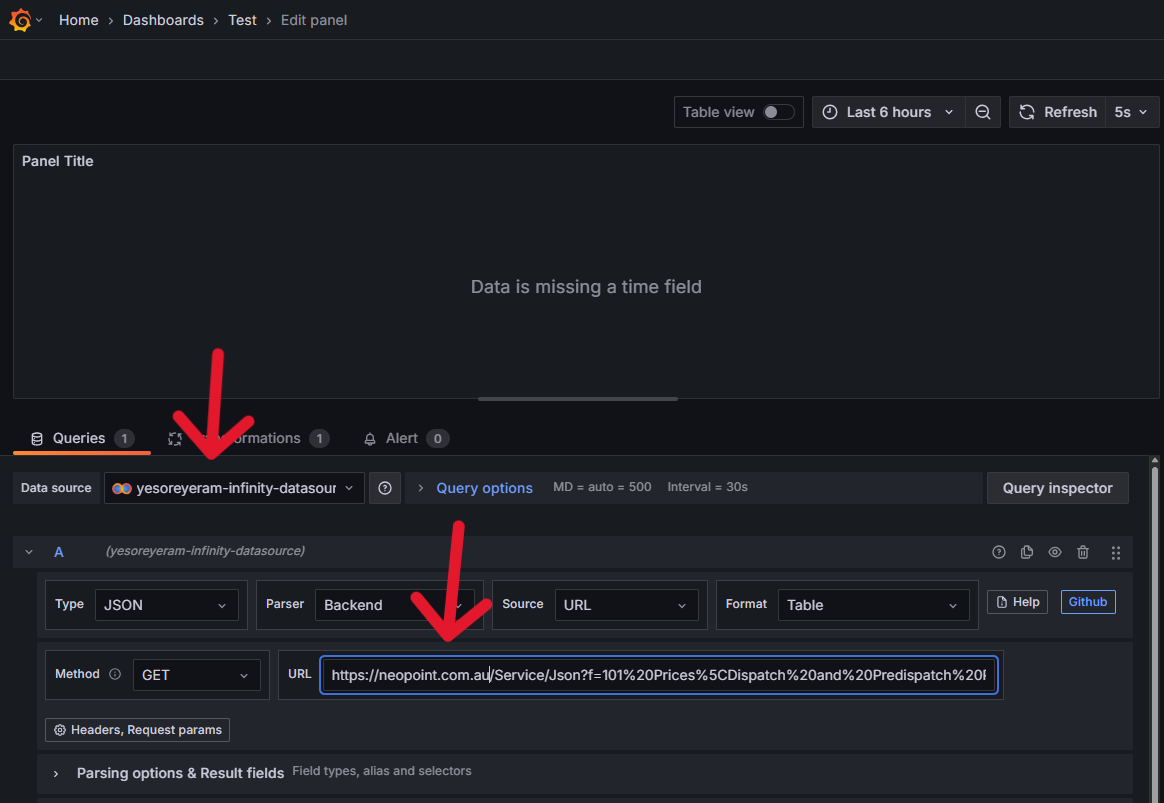
Data should now be viewable under “table view” but wont show as a graph since Grafana doesn’t know the “DateTime” field is a “Time” data type.
To visualise data as a graph you need to add a transformation to the “DateTime” field as shown in the image below:
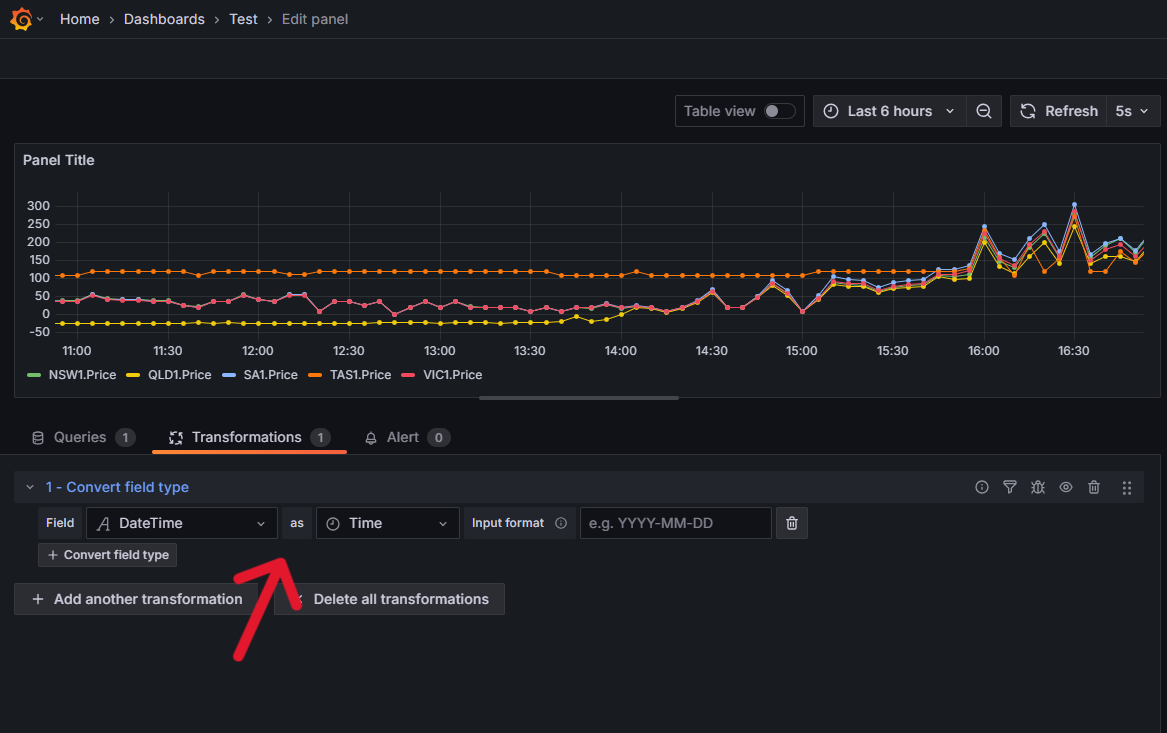
Once the data is visible, you are free to customise the panel using Grafana's extensive configuration options.
Updated 16 days ago